


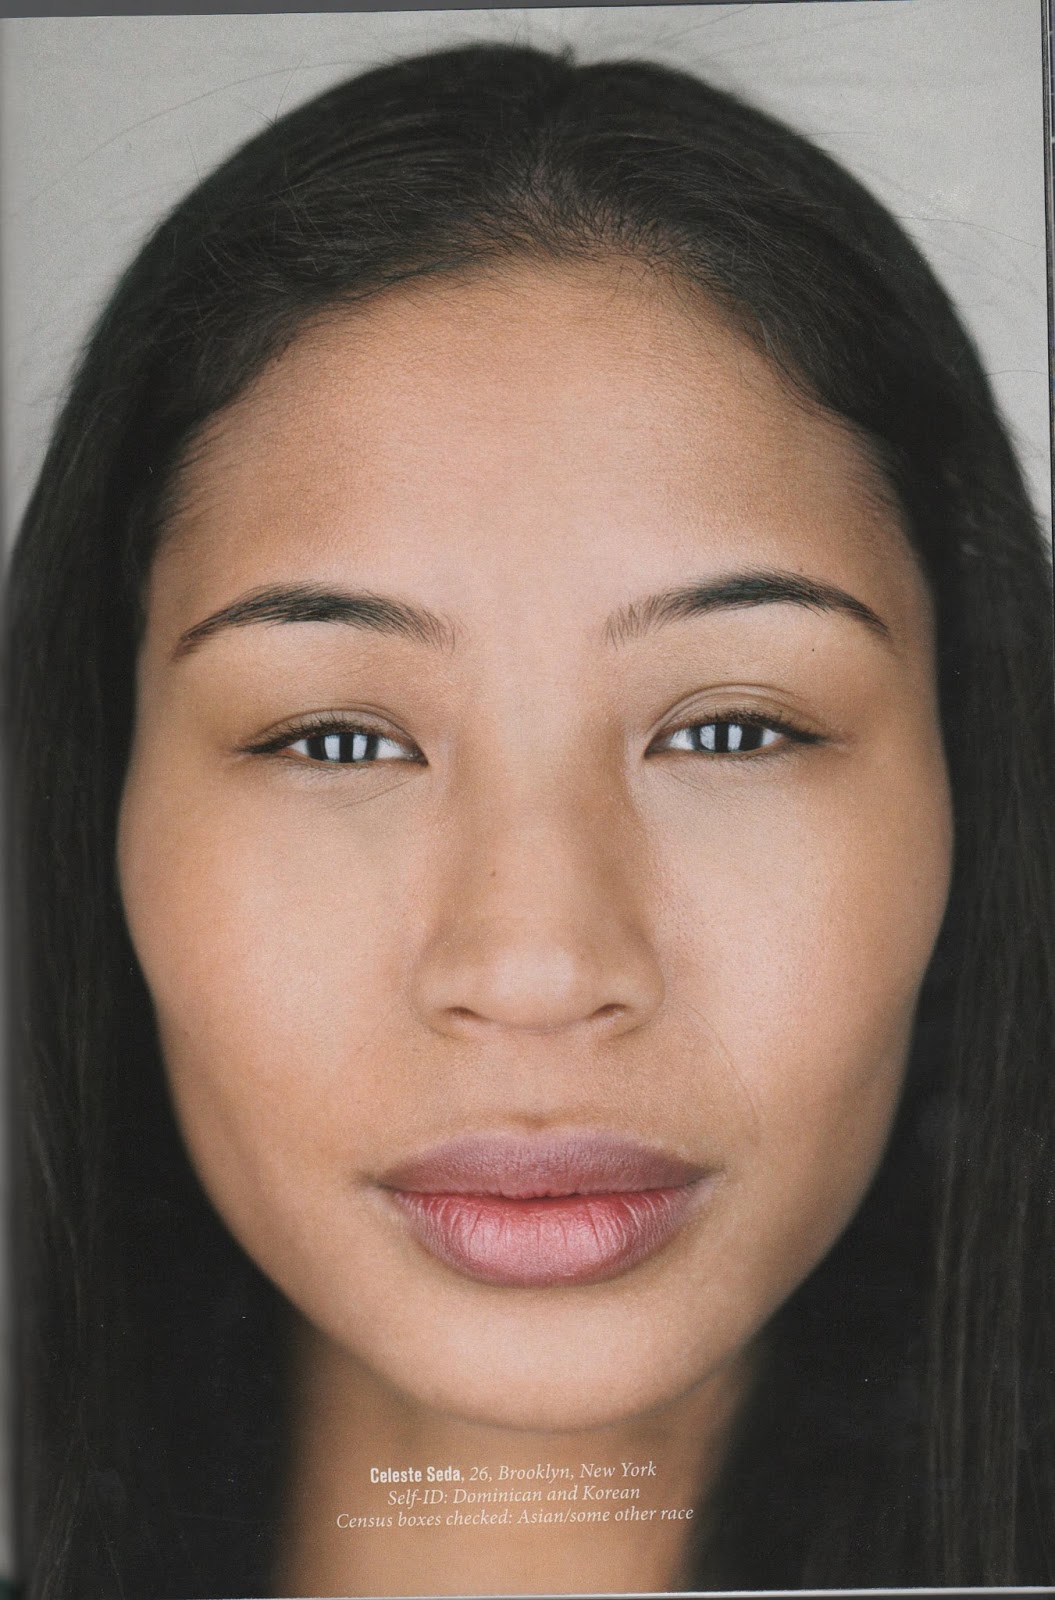

Pay Close Attention To The Mandible And Maxilla Projection (See It Move?). She, Like Most Blacks, Has A Moderate Case Of Prognathism Or What We In The Business Like To Call "The Monkey Mouth." The 0:55 Second Mark In The Video Above.
Racial Differences In Skull Shapes


LOOK LIKE MAN, UGLY MAN!
Why Are Black Women Less Physically Attractive Than Other Women? Why black women, but not black men? Published on May 15, 2011 by Satoshi Kanazawa in The Scientific Fundamentalist
There are marked race differences in physical attractiveness among women, but not among men. Why?
Add Health measures the physical attractiveness of its respondents both objectively and subjectively. At the end of each interview, the interviewer rates the physical attractiveness of the respondent objectively on the following five-point scale: 1 = very unattractive, 2 = unattractive, 3 = about average, 4 = attractive, 5 = very attractive. The physical attractiveness of each Add Health respondent is measured three times by three different interviewers over seven years.
From these three scores, I can compute the latent "physical attractiveness factor" by a statistical procedure called factor analysis. Factor analysis has the added advantage of eliminating all random measurement errors that are inherent in any scientific measurement. The latent physical attractiveness factor has a mean of 0 and a standard deviation of 1.
Recall that women on average are more physically attractive than men. So women of all races are on average more physically attractive than the "average" Add Health respondent, except for black women. As the following graph shows, black women are statistically no different from the "average" Add Health respondent, and far less attractive than white, Asian, and Native American women.
In contrast, races do not differ in physical attractiveness among men, as the following graph shows. Men of all races are more or less equally less physically attractive than the "average" Add Health respondent.
This sex difference in the race differences in physical attractiveness – where physical attractiveness varies significantly by race among women, but not among men – is replicated at each Add Health wave (except that the race differences among men are statistically significant, albeit substantively very small, in Wave III). In each wave, black women are significantly less physically attractive than women of other races.
It is very interesting to note that, even though black women are objectively less physically attractive than other women, black women (and men) subjectively consider themselves to be far more physically attractive than others. In Wave III, Add Health asks its respondents to rate their own physical attractiveness subjectively on the following four-point scale: 1 = not at all, 2 = slightly, 3 = moderately, 4 = very. As you can see in the following graphs, both black women and black men rate themselves to be far more physically attractive than individuals of other races.
What accounts for the markedly lower average level of physical attractiveness among black women? Black women are on average much heavier than nonblack women. The mean body-mass index (BMI) at Wave III is 28.5 among black women and 26.1 among nonblack women. (Black and nonblack men do not differ in BMI: 27.0 vs. 26.9.) However, this is not the reason black women are less physically attractive than nonblack women. Black women have lower average level of physical attractiveness net of BMI. Nor can the race difference in intelligence (and the positive association between intelligence and physical attractiveness) account for the race difference in physical attractiveness among women. Black women are still less physically attractive than nonblack women net of BMI and intelligence. Net of intelligence, black men are significantly more physically attractive than nonblack men.
There are many biological and genetic differences between the races. However, such race differences usually exist in equal measure for both men and women. For example, because they have existed much longer in human evolutionary history, Africans have more mutations in their genomes than other races. And the mutation loads significantly decrease physical attractiveness (because physical attractiveness is a measure of genetic and developmental health). But since both black women and black men have higher mutation loads, it cannot explain why only black women are less physically attractive, while black men are, if anything, more attractive.
The only thing I can think of that might potentially explain the lower average level of physical attractiveness among black women is testosterone. Africans on average have higher levels of testosterone than other races, and testosterone, being an androgen (male hormone), affects the physical attractiveness of men and women differently. Men with higher levels of testosterone have more masculine features and are therefore more physically attractive. In contrast, women with higher levels of testosterone also have more masculine features and are therefore less physically attractive. The race differences in the level of testosterone can therefore potentially explain why black women are less physically attractive than women of other races, while (net of intelligence) black men are more physically attractive than men of other races.


That African DNA is the closest to chimpanzees is an open secret among a small circle of experts. No one (dare) discusses its significance, so it is unknown to most. There are many papers on this. The one with the most complete data is (Extended Fig 5).
Africans the last to become modern homo based on 3 open secrets. 1. More similar to chimpanzees in DNA than others do. 2. Highest genetic diversity but becoming higher species is associated with lower GD. 3. Largest # of protein truncating variants.
The first modern people at ~50-200 kya should have more fixed differences from chimpanzees than other contemporaneous people, which is partly why they were modern. They have more derived alleles (non-chimp) and less ancestral/primitive alleles and hence have more modern traits.

https://twitter.com/AthletWhisperer/status/1218432930973769728/photo/1
LOOKS LIKE MAN! NO WONDER SON SO MUSCULAR AND PHYSICALLY MATURE. HE PRODUCT OF 2 MAN!
LOOKS LIKE MAN! NO WONDER SON SO MUSCULAR AND PHYSICALLY MATURE. HE PRODUCT OF 2 MAN!


Look At All Of These Unattractive Black Girls. Even The Attractive Ones Are Unattractive!
Look At All Of These Unattractive Black Girls! There's Only One Decent Looking One And That's The Black Hamo One (Second From Left; Their Left).

Mannish, Masculine Androgen Created Face To The Left Of Your Screen That Slightly Resembles Serena Williams's (I'm Referring To Dr. Rivers's Daughter, I Believe). Somewhat Look Like Planet Of Ape Girl!

Who's Who In The DNA Chromosomes Below. See If You Can Match Their Portraits To Their Genetic Portraits.
 |
| Look At The Genetic Makeup Of Random People From Throughout The U.S. (Everyone Has An Alias Here Except For Dr. Henry Louis Gates Jr.) |
 |
| Look At The Genetic Makeup Of Random People From Throughout The U.S. (Everyone Has An Alias Here Except For Bryan Sykes) |
 |
| Look At The Genetic Makeup Of Random People From Throughout The U.S. |

...Basically, we want to compare the amounts of morphological change along various lineages of interest here to see, for example, whether in fact going beyond skin deep markedly reduces the amount of variability present. My (Sarich's) involvement in this realm began in 1994 with the publication of and controversy around The Bell Curve. In a debate, I made the flat statement that "racial morphological distances within our species are, on the average, about equal to the distances among species within other genera of mammals. I am not aware of another mammalian species whose constituent races are as strongly marked as they are in ours." And then I always had to add, "except, of course, domesticated dogs." But I left it there for several years until I was able to get some ape measurements from Colin Groves of the Australian National University in Canberra. Our data set was then cranial/facial measurements on 29 human populations, 2,500 individuals, 28 measurements, from W.W. Howells at Harvard; 17 measurements on 347 chimpanzees (Groves); and 25 measurements on 590 gorillas (Groves). Chimps are generally divided into two species (the pygmy chimpanzee, or bonoboo, Pan paniscus; and the common chimp, or P. troglodytes), which has three subspecies (races if one wishes): troglodytes, verus, and schweinfurthii. There is less agreement on gorillas, but there are two distinct groups, probably species, Gorilla gorilla in the west and four closely related groups in the east.
The metric I have used is the percentage difference per size-corrected measurement (expressed as standard deviation units), and the numbers given are the present increases in distance going from within-group to between-group comparisons of individuals. Thus, the increase in average distance in going from the paired comparisons of two males to similar comparisons for male and female pairings in some human populations is about 1-2.5 percent: for example, for Zulu, 1.15 percent; Australia, 1.87 percent; and Santa Cruz Island (California), 2.16 percent.
For pygmy chimps, the corresponding increase for male-female versus male-male comparisons is 4.7 percent; for common chimps it is 10.4 percent. These figures are consistent with the general sense that the degree of sexual dimorphism increases as we go from humans to pygmy chimps to common chimps.
Comparing distances among the three common chimp subspecies or races (for males) gives about 6 percent between verus and either schweinfurthii or troglodytes, and 1.6 percent (which is essentially noise level) between the latter two. From bonobo to verus is about 20 percent; to troglodytes, 14.6 percent; and to schweinfurthii, 8.8 percent. These three bonoboo morphological distances are correlated with the corresponding geographical distances, and one has to wonder to what extent the smaller paniscus - schweinfurthii number is due to parallel evolution and how much to gene flow between the two sometime after the basic chimp - bonoboo split occurred. Neither I nor anyone else as yet presumes to have the answer to that one.
For gorillas the basic split is between the western form (G. gorilla) and four eastern populations (three races of G. graueri and G. berengi, the "mountain gorilla"); those percentages are 17.3, 19.8, 22.9. and 24.7, respectively. Between graueri race 1 and the other three eastern forms, the percentages are 7.9, 12.8, and 12.3. Between graueri race 2 and the others, the differences are 4 percent and 11.1 percent. Between graueri race 3 and berengi, the difference is 8.4 percent.

"EWW EWW AHH AHH
EWW EWW AHH AHH
EWW EWW AHH AHH"
Those are the ape numbers I've calculated to date. What about humans? These data come from comparing three African samples: the Dogon of Mali, the Teita (Kenyan Bantu speakers), and the South African Bushman. The percentages are Dogon to Teita, 9.9; Dogon to Bushman, 13.4; and Teita to Bushman, 14.9. Thus the Dogon or Teita to Bushman "racial" distance is very much like the 14.6 percent separating two chimpanzee species (using the P.t. troglodytes to bonoboo number). Similar percentages (16.3 and 15.5, respectively) are obtained when comparing a sample from Hokkaido (Japanese, not Ainu) and two Amerindian groups (the Arikara from South Dakota and a sample from Santa Cruz Island). Other comparisons that help put these distances in perspective are South Australia to Tolai (a New Britain group), 10 percent; Dogon to Norse, 19.4 percent; and South Australia to Norse, 26 percent.
The largest distance among chimpanzees or gorillas (the 24.7 percent between G. gorilla and G. berengi) is slightly less than that separating Howells's Norse and the South Australian samples (26 percent), but even this doesn't begin to exhaust the range of human variation. The largest differences in Howells's sample are found when comparing Africans with either Asians or Asian-derived (Amerindian) populations. Thus Teita to Tierra del Fuegans is 32.4 percent; Zulu to Tierra del Fuegans or Santa Cruz yields about 36 percent. The largest difference for any of the human data set is 46 percent, which comes from comparing Teita with Buriat (who live in the Lake Baikal area and speak a Mongolian language).
...
Who would have predicted that the racial morphological distances in our species could be much greater than any seen among chimpanzees or gorillas, or, on the average, some tenfold greater than those between the sexes? I think it is fair to say no one. I have posed the question to a number of audiences and individuals, lay and professional, and the modal estimate has tended to be about twofold - that is, about twice the distances between human sexes.
So now we have some useful numbers that help to solve the matter of whether the degree of variation in morphological features is high, low, or just middling. The answer cannot be known without having a standard of comparison available. Here the chimp and gorilla can be the standards. The two chimpanzee species differ from each other by about 15 percent on the morphological distance scale, and a comparable pair of human populations are Japanese and Arikara. But not until the data are put on a time scale does the significance of this experiment become clear.
Molecular data suggest that the two chimpanzee lineages separated around 1.5 million years ago; the comparable human figure is on the order of 15, 000 years. In other words, the chimp lineages are 100-fold older, yet show the same amount of variation. This is a remarkable result, the implications of which take a while to sink in. The implications follow this logic: Human races are very strongly marked morphologically; human races are very young; so much variation developing in so short a period of time implies, indeed almost certainly requires, functionality; there is no good reason to think that behavior should somehow be exempt from this pattern of variability.
Race: The Reality of Human Differences, Sarich, Miele, p. 170-173.


